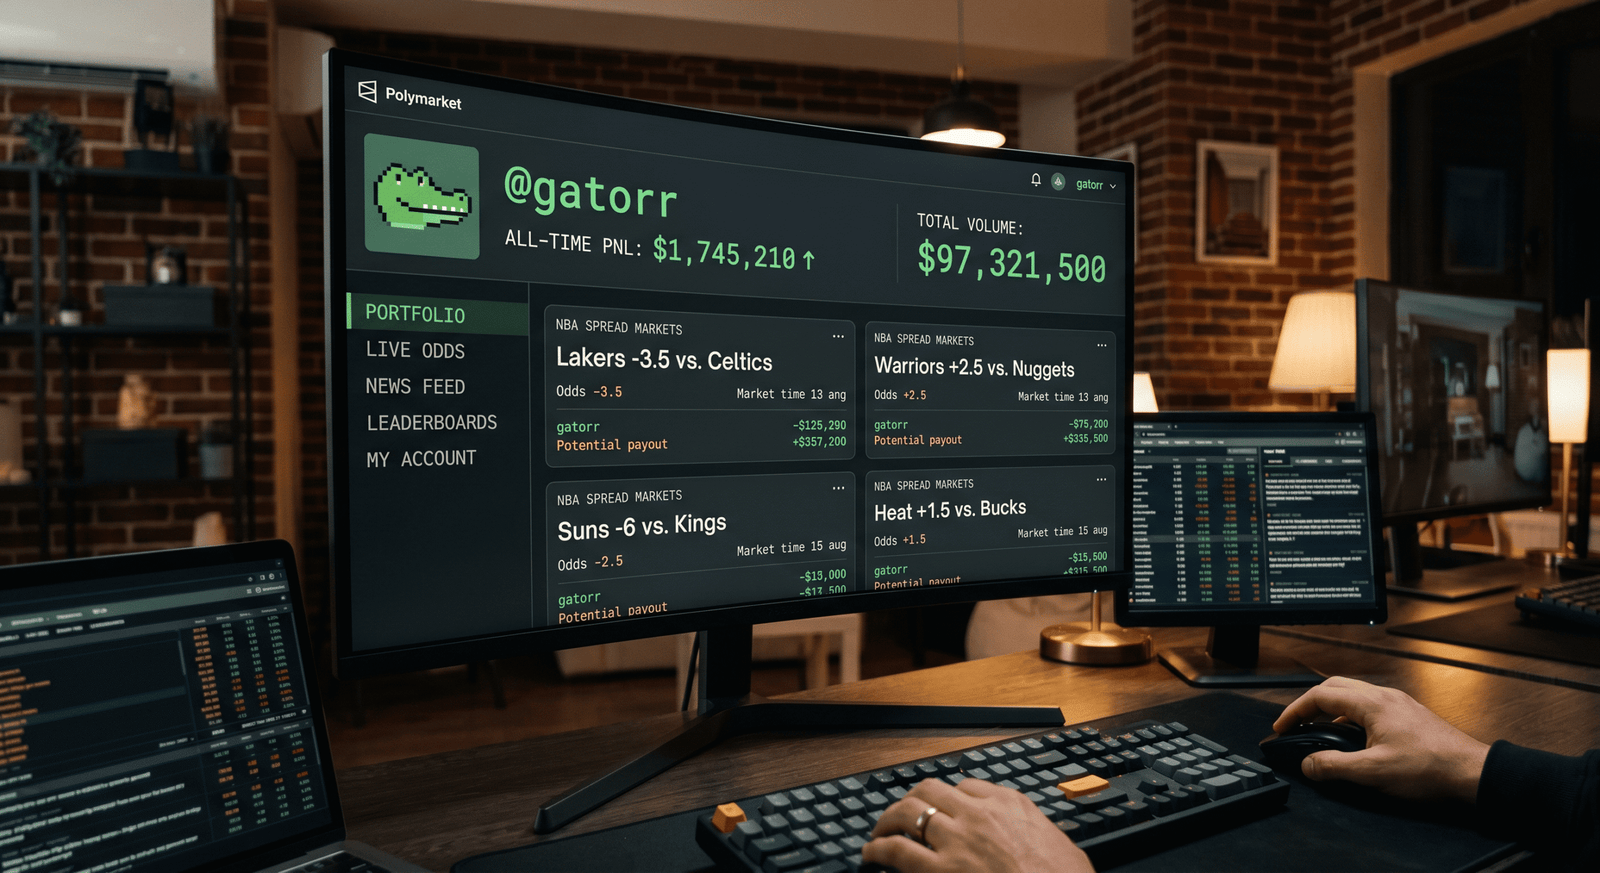
gatorr Polymarket: $1.7M All-Time. $97M Volume. The NBA Spread Specialist Built on Consistency.
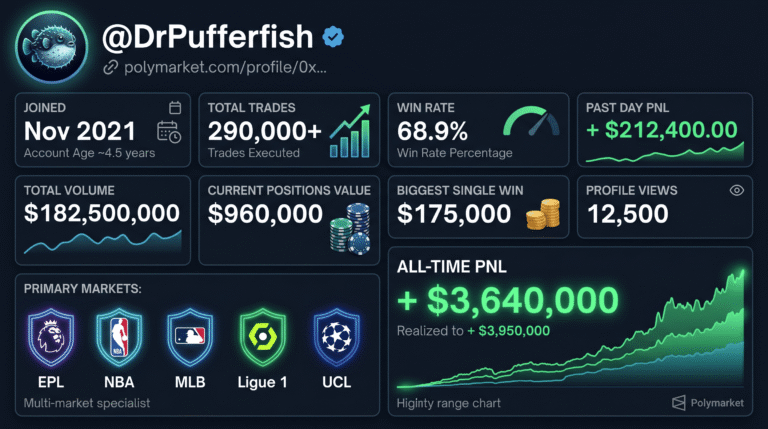
gatorr has been trading on Polymarket since early 2026 and has generated $1,660,000 to $1,700,000 in all-time PnL on $53,900,000 to $97,300,000 in total volume across 862-plus markets. Specifically, wallet 0x93abbc022ce98d6f45d4444b594791cc4b7a9723 carries a 49% win rate across hundreds of trades, a confirmed $2,000,000 total profit in one analyzed period scaling from consistent $11,000 to $45,000 position sizes, and a steady monthly output of approximately $1,000,000 during peak performance windows. Here is the complete strategy breakdown, the NBA spread specialisation, the sizing discipline that makes this wallet a consistent copy-trading target, and what $1.7M in net profit at a 49% win rate tells you about how professional prediction market sports traders actually generate returns.
gatorr Polymarket: Profile at a Glance
| Data Point | Detail |
|---|---|
| Username | @gatorr |
| Wallet | 0x93abbc022ce98d6f45d4444b594791cc4b7a9723 |
| Active Since | Early 2026 |
| Markets Traded | 862+ |
| Total Volume | $53,900,000 to $97,300,000 |
| All-Time PnL | +$1,660,000 to +$1,700,000 |
| Win Rate | ~49% |
| Typical Trade Size | $10,000 to $45,000 |
| Peak Monthly Profit | ~$1,000,000 |
| Primary Markets | NBA spreads and over/unders |
| Secondary Markets | UEFA, tennis, other sports |
| Style | High-frequency sports specialist |
| Copy Appeal | High — tracked on Polywhaler and Predictr |
The Industry Context: Why gatorr Exists in 2026
The prediction market landscape in late May 2026 is the most favorable environment ever recorded for high-frequency sports specialists. Kalshi processes approximately $3,900,000,000 in weekly volume with 80% to 90% sports weighting. Polymarket runs approximately $1,600,000,000 in weekly volume with sports accounting for approximately 39% — a figure that rises significantly during peak NBA playoff and UEFA periods.
Combined weekly industry volume of $5,000,000,000 to $6,000,000,000 with live in-play sports driving real-time engagement means the market conditions that gatorr operates in are structurally optimal for the volume-plus-speed model. Specifically, NBA playoff games provide daily high-liquidity in-play windows. UEFA matches add afternoon European coverage. Tennis adds continuous throughout-the-day opportunities. The three categories running simultaneously across different global time zones create a prediction market equivalent of a 16-hour-per-day liquid sports trading session.
gatorr’s 862-plus markets traded and $53.9M to $97.3M in volume is the operational footprint of a trader built for exactly this environment.
The 49% Win Rate With Positive PnL: How It Works
The Core Mathematical Logic
The 49% win rate generating $1,660,000 to $1,700,000 in net positive PnL is the most analytically important feature of the gatorr profile. Below-50% accuracy producing positive returns is only possible through asymmetric position sizing — consistent winners must exceed consistent losers in absolute dollar value.
The documented figures confirm this structure directly. In one analyzed period, gatorr generated approximately $2,000,000 in total profit scaling from positions in the $11,000 to $45,000 range. Specifically, the average profitable trade size exceeds the average losing trade size — meaning when gatorr wins, it wins more dollars than it loses on the larger number of losing trades.
This is the same structural principle documented for DrPufferfish at 3.36x average win-to-loss ratio, GamblingIsAllYouNeed at 1x wins covering 33% win rate through entry price optimization, and wan123 at 1.87x win-to-loss size ratio at 48.5% win rate. The pattern across all high-volume positive-net-PnL wallets with sub-50% win rates is consistent: the model does not require accuracy above 50% when entry price selection produces asymmetric payout structures.
Why 49% Win Rate Is Sustainable at This Volume
At 595 bets in one three-month snapshot across an 862-market history, gatorr is averaging approximately 4 to 6 trade executions per day. At $10,000 to $45,000 per trade and a 49% win rate with favorable average win-to-loss sizing, the expected daily profit is consistently positive despite the slight majority of trades resolving as losses.
The specific advantage of sports spreads and totals as the primary market is that the pricing is binary-adjacent — a spread resolves Yes or No regardless of the margin. A team either covers a -10.5 spread or does not. This binary resolution means position sizing controls the entire outcome rather than a complex probability distribution. Buying the Pistons -10.5 at 48 cents when the analytical thesis says the Pistons should cover means a $20,000 entry returns $21,666 profit on a win and loses $20,000 on a loss — and the 49% win rate only needs to exceed the break-even point implied by the entry price, which at 48 cents is 48%.
The NBA Spread Specialisation: The Core Edge
Documented Markets and Wins
Specific documented positions in the gatorr record include NBA spread markets such as Pistons -10.5 and Mavericks vs Cavaliers over/under totals. These are representative of the broader NBA spread portfolio rather than isolated examples.
NBA spreads on Polymarket in 2026 represent the highest-liquidity domestic sports category available to prediction market traders. The crowd pricing in NBA spread markets is set by the combined betting activity of retail participants, copy-traders following whale wallets, and occasional sharp money — without the market-maker discipline that exists in traditional sportsbooks. This creates specific systematic mispricings that sophisticated analysts can exploit.
The Pistons -10.5 position specifically represents a large-spread market where the crowd must assess not just who wins but the margin of victory. Large spread markets carry higher analytical complexity than simple moneylines, creating wider pricing inefficiencies for traders with genuine NBA analytical capability.
Volume as the Edge Amplifier
The most significant strategic feature of gatorr’s NBA approach is consistent volume across many game-day events rather than concentration in single large bets. Specifically, distributing $10,000 to $45,000 positions across multiple games on the same date creates portfolio-level consistency that single large-bet approaches cannot achieve.
Copy-trading simulations starting with $1,200 reportedly generated strong multiples by mirroring gatorr’s positions — confirming the edge is systematic and replicable at smaller scale rather than dependent on position size advantages unavailable to smaller traders. This copy-trade appeal is structurally different from the Theo4 or gfjoigfsjoigsjoi models where position sizes are so large that exact replication requires comparable capital. gatorr’s $10,000 to $45,000 range allows proportional copying at retail capital levels.
The Sizing Discipline: What $10K to $45K Per Trade Actually Means
The Risk Management Rationale
The $10,000 to $45,000 position range is not arbitrary — it reflects a deliberate risk management framework that balances absolute return potential against variance protection.
At $45,000 maximum position size, a single losing trade costs at most $45,000 in capital exposure. At $97,300,000 in total volume across 862 markets, the average position size is approximately $112,878 per market entry. The $10,000 to $45,000 range for individual game bets within multi-game sessions is consistent with an average market entry of this size when multiple positions across different spread and total types within the same game cluster are counted as one market entry.
Contrast this with surfandturf’s $310,000 single-game positions or LaBradfordSmith22’s $278,737 individual NHL position. The smaller sizing in gatorr’s model means no single game outcome can materially impact the all-time PnL — the same structural safety documented for ferrarichampions2026 and GamblingIsAllYouNeed.
The Monthly Consistency Signal
The approximately $1,000,000 monthly profit in peak performance windows across the gatorr record is the most important durability indicator. Monthly consistency at this level requires the strategy to work across different NBA game schedules, different team performance cycles, and different market liquidity conditions throughout the month.
A wallet that generates $1,000,000 in one specific month due to a lucky streak of large individual bets does not show the same profile as a wallet generating $1,000,000 from 200-plus smaller positions consistently resolving at a favorable net margin. The 595 bets in one three-month snapshot implies approximately 198 bets per month — a volume that requires consistency rather than occasional large wins.
What Makes gatorr a Copy-Trading Target
The documented copy appeal on platforms like Polywhaler and Predictr reflects three structural features that distinguish gatorr from high-variance conviction whales.
The first is position size accessibility. A trader with $5,000 to $50,000 in capital can proportionally replicate $10,000 to $45,000 positions at 10% to 100% scale. High-conviction whales like surfandturf deploying $310,000 on single games cannot be meaningfully copied at retail capital levels.
The second is strategy predictability. NBA spread and total markets follow a predictable daily schedule during the playoff season. Gatorr’s market focus is well-defined and consistent — not the diverse portfolio of newdogbeginning covering Senate midterms, Arsenal soccer, Bitcoin thresholds, and NBA simultaneously. Predictable market focus allows copy-traders to monitor the same category continuously.
The third is steady monthly output rather than high variance. The approximately $1,000,000 peak monthly figure represents consistent accumulation rather than the boom-bust cycle of imnotawizard building $3.5M and losing $2.4M in a month. Copy-traders following consistent monthly performers absorb lower single-session variance than those following high-conviction specialists.
The Loss Patterns: What the 49% Win Rate Costs
Sports Reversals and Live Momentum Shifts
The primary documented loss driver is live momentum shifts in NBA games where positions entered on one team’s expected outcome reverse during the game. In-play NBA markets reprice rapidly when leads change hands, key players foul out, or injury substitutions affect the game flow. A position entered at 60 cents on a team covering a -10.5 spread can drop to 25 cents within minutes of a momentum reversal.
The documented response to this risk — cutting losers early — is the same discipline identified in the DrPufferfish profile. Positions are not held through adverse momentum to recover at resolution. They are exited when the analytical thesis no longer holds, accepting the partial loss rather than the full stake loss at resolution.
Hedging Costs
Like DrPufferfish, gatorr absorbs hedging costs as a structural feature of the model. Positions entered as insurance against larger book exposure resolve as losses but protect the overall position from catastrophic adverse outcomes. These are intentional losses that reduce the effective win rate below 50% while generating net positive expected value across the full portfolio.
Counterparty Sharp Money
The third loss driver is direct competition from sharper counterparty money in high-liquidity events. NBA playoff games attract the most sophisticated prediction market participants — sovereign2013, RN1, and 0x492442 all operate heavily in the same NBA spread and total markets. When multiple professional operators target the same game, the pricing efficiency increases and per-trade edges narrow.
gatorr vs The Current NBA and Sports Whale Tier
| Wallet | All-Time PnL | Volume | Win Rate | Avg Trade Size | Style |
|---|---|---|---|---|---|
| DrPufferfish | +$3.6M | $84.5M gross | 48-53% | Higher | In-play scalper |
| sovereign2013 | +$3.4M | $381M to $397M | 52.6% | ~$1,127 avg win | NBA execution bot |
| gatorr | +$1.7M | $53.9M to $97.3M | 49% | $10K to $45K | NBA spread specialist |
| Soarin22 | +$1.4M to $1.9M | $72.6M | 52-53% | ~$39,521 | NBA and golf |
| Countryside | +$1,572,870 | $381M to $397M | 48.5% | $200K to $700K | NBA accumulator |
| 0x492442 | -$11M net | $96M+ gross | 47.9% | ~$136K avg win | NBA execution bot |
gatorr’s $1.7M all-time PnL at 49% win rate across $53.9M to $97.3M in volume sits in the mid-tier of named NBA-focused wallets. The closest structural comparison is Countryside at $1,572,870 all-time and 48.5% win rate — both wallets generating positive net PnL at sub-50% win rates through asymmetric sizing.
The comparison to 0x492442 at 47.9% win rate and -$11M net despite $96M in gross wins is the most instructive contrast. 0x492442 and gatorr operate at similar win rates in similar NBA markets. The difference is that 0x492442 uses average positions of approximately $136,000 where the average loss slightly exceeds the average win — generating negative net despite enormous gross volume. gatorr’s smaller position sizes and documented ability to cut losers faster produces positive net at comparable win rate accuracy.
Key Takeaways for CoinTrenches Readers
The $10,000 to $45,000 position size discipline is the most transferable insight from the gatorr profile. Every documented multi-million-dollar single-game loss in the current CoinTrenches research — imnotawizard’s $2.4M Liverpool bet, dhdhsjsj’s $628K Dota 2 bet, blindStaking’s $1.87M Madrid Derby — came from position sizes that could not be absorbed by the broader portfolio. gatorr’s sizing ceiling means no single NBA game can produce a portfolio-ending loss event.
The copy-trading appeal is the most distinctive community signal. A $1,200 starting capital generating strong multiples by mirroring gatorr’s positions — as documented in copy-trading simulations — confirms this is one of the few named whale wallets in the current tracked set where retail-scale proportional replication of the strategy is operationally feasible. Most top wallets (gfjoigfsjoigsjoi, Theo4, surfandturf) deploy capital at scales that require meaningful capital to proportionally mirror.
The approximately $1,000,000 peak monthly profit from consistent $10,000 to $45,000 positions across hundreds of NBA games confirms the volume model works. The math is straightforward: 200 positions per month at $11,000 to $45,000 average stake, 49% win rate with favorable win-to-loss size ratio, generates six-figure to seven-figure monthly net depending on the specific win-to-loss size spread achieved.
Keep Reading on CoinTrenches
| Whale | All-Time PnL | Category | Link |
|---|---|---|---|
| SwissTony | +$7.06M | Soccer Arb | SwissTony Polymarket: $7M All-Time, $722M Volume |
| GamblingIsAllYouNeed | +$5M | Sports Scatter | GamblingIsAllYouNeed Polymarket: $5M PnL, $401M Volume |
| DrPufferfish | +$3.6M | Live Sports Scalper | DrPufferfish Polymarket: $3.6M All-Time, 290K Trades |
| LaBradfordSmith22 | +$3.4M | NBA and Soccer | LaBradfordSmith22 Polymarket: $3.4M All-Time Updated |
| sovereign2013 | +$3.4M | Sports Bot | sovereign2013 Polymarket: $3.4M All-Time, Sports Bot |
| Cannae | +$1.9M to $2.1M | Soccer | Cannae Polymarket: $1.9M All-Time, Soccer Whale |
| Soarin22 | +$1.4M to $1.9M | NBA and Golf | Soarin22 Polymarket: $1.4M All-Time, OKC Thunder and PGA |
| wan123 | +$1.1M | Mixed Sports | wan123 Polymarket: $1.1M Net PnL, $854K Open |
| 0x492442 | -$11M Net | NBA Bot | 0x492442 Polymarket: $96M Gains, -$11M Net, NBA Bot |
| Countryside | +$1.57M | NBA Accumulator | Countryside Polymarket: +$1.57M All-Time, Top 15 Wins Ranked |
| pinebluff | Positive | LoL Esports | pinebluff Polymarket: $681K Open, League of Legends Whale |
Frequently Asked Questions
Who is gatorr on Polymarket?
gatorr is a Polymarket NBA sports specialist at wallet 0x93abbc022ce98d6f45d4444b594791cc4b7a9723. The account has been active since early 2026 and has traded across 862-plus markets generating $1,660,000 to $1,700,000 in all-time PnL on $53,900,000 to $97,300,000 in total volume. The win rate is approximately 49%. Typical position sizes run $10,000 to $45,000 per trade. The wallet is tracked on Polywhaler and Predictr as a copy-trading target due to its steady monthly performance.
How does gatorr make money at a 49% win rate?
The 49% win rate produces positive net PnL because average winning positions exceed average losing positions in absolute dollar value. In one analyzed period, $2,000,000 in total profit was generated scaling from $11,000 to $45,000 position sizes — confirming that when gatorr wins, it wins more dollars per trade than it loses on the more frequent losing trades. The discipline of cutting losing positions early before full resolution keeps the average loss size controlled while letting winning positions run to full resolution.
What NBA markets does gatorr trade on Polymarket?
The primary markets are NBA point spreads and over/under totals. Documented specific positions include Pistons -10.5 spreads and Mavericks vs Cavaliers over/under markets. The strategy covers multiple games per day during active NBA schedule periods, distributing $10,000 to $45,000 across different spread and total markets across multiple simultaneous games rather than concentrating capital in one large single-game bet.
Is gatorr a good copy-trading target on Polymarket?
Copy-trading simulations starting with $1,200 in capital reportedly generated strong multiples by mirroring gatorr’s positions — making it one of the more accessible named whale copy targets in the current tracked set. The $10,000 to $45,000 typical position range allows proportional replication at retail capital levels, unlike high-conviction whales deploying $200,000 to $800,000 per position. The steady monthly output rather than boom-bust variance also makes the equity curve smoother for copy-traders to follow.
How does gatorr compare to 0x492442 in NBA markets?
Both wallets trade NBA spreads and totals at approximately 47% to 49% win rates in similar market categories. The key difference is position sizing and loss management. 0x492442 deploys average individual positions of approximately $136,000 with average losses slightly exceeding average wins — generating -$11M net despite $96M in gross wins. gatorr deploys $10,000 to $45,000 per trade with documented ability to cut losers early — generating +$1.7M net at a similar win rate. The gap between positive and negative net PnL at comparable accuracy comes entirely from position sizing discipline and loss management.