DrPufferfish Polymarket: $3.6M All-Time. 290,000 Trades. The High-Volume Scalper in the Top 1%.
DrPufferfish has been trading on Polymarket since May 2025 and has executed approximately 290,000 trades across 1,589-plus markets in just over a year. The all-time PnL sits between $1,960,000 and $3,600,000 depending on the tracker and whether unrealized positions are included, with the most comprehensive figure landing at $3,600,000 — placing the wallet in the top 1% of all Polymarket traders by lifetime profit. Specifically, wallet 0xdb27bf2ac5d428a9c63dbc914611036855a6c56e carries a 48.4% to 53% win rate, $44,100,000 in gross wins against $40,400,000 in gross losses, a 3.9% net ROI, and a confirmed biggest single win of approximately $1,300,000. Here is the complete strategy breakdown, the Liverpool edge that generated $1,600,000 alone, the in-play scalping model, and what $3.6M in net profit at a sub-53% win rate tells you about high-volume prediction market trading in 2026.
DrPufferfish Polymarket: Profile at a Glance
| Data Point | Detail |
|---|---|
| Username | DrPufferfish |
| Wallet | 0xdb27bf2ac5d428a9c63dbc914611036855a6c56e |
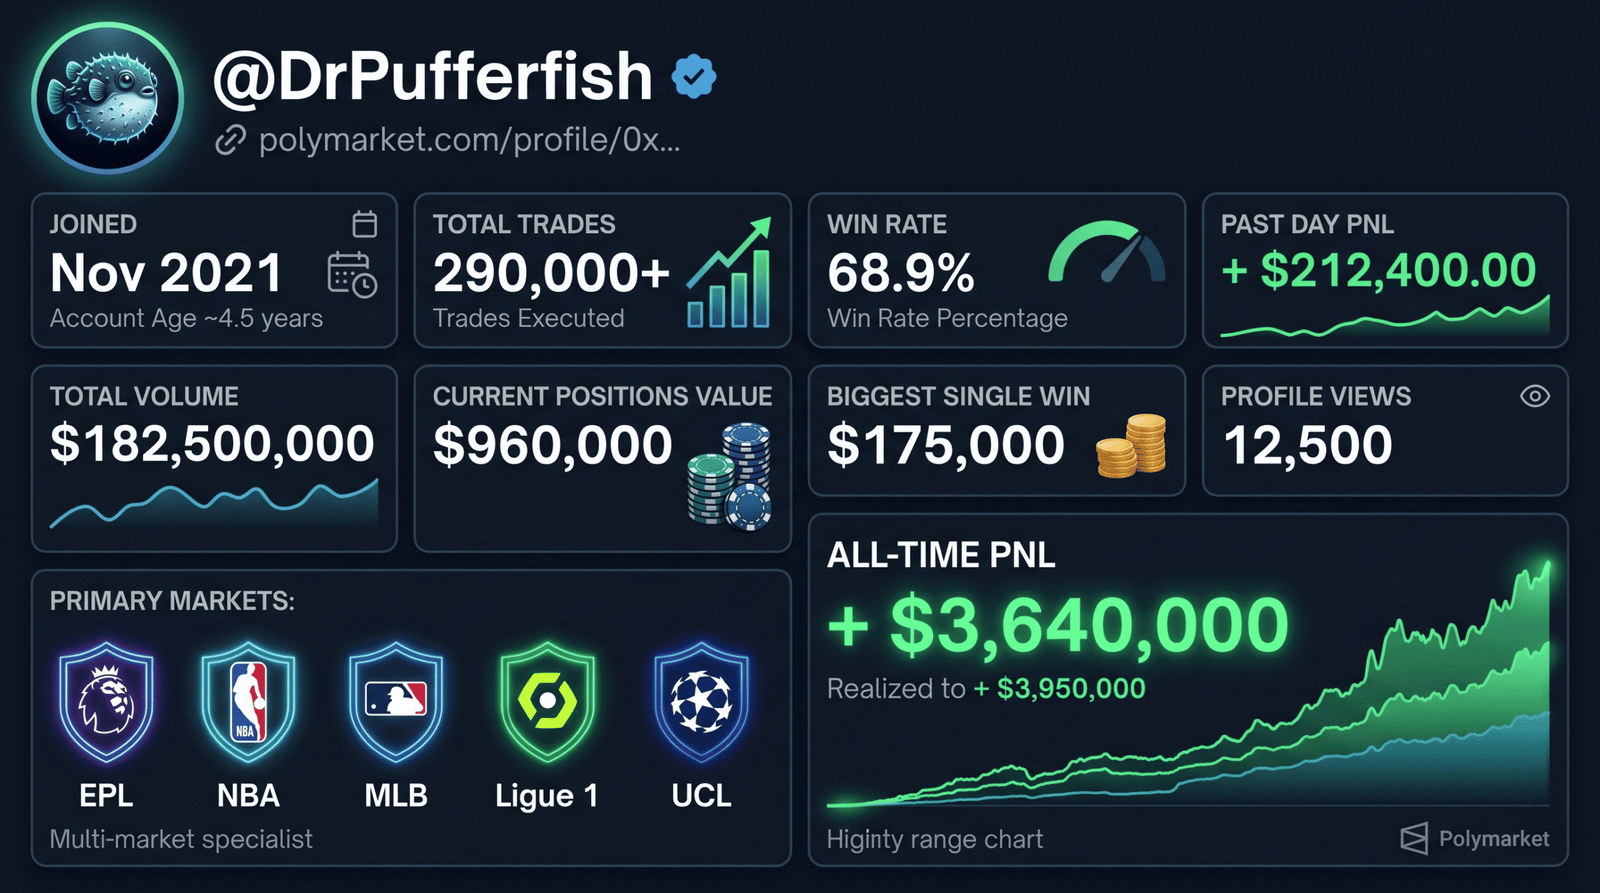
| Joined | May 2025 |
| Account Age | ~13 months |
| Total Trades | ~290,000+ |
| Markets Traded | 1,589+ |
| All-Time PnL | +$1.96M to +$3.6M |
| Gross Wins | +$44,100,000 |
| Gross Losses | -$40,400,000 |
| Net ROI | +3.9% |
| Win Rate | 48.4% to 53% |
| Max Drawdown | -$4,200,000 |
| Biggest Single Win | ~$1,300,000 |
| Current Positions Value | $181,000 to $888,000 |
| Leaderboard Rank | Top 15 to 20 overall by PnL |
| Primary Markets | Premier League, UEFA, NBA, tennis, crypto, politics |
| Style | High-frequency in-play scalper with hedging |
The PnL Structure: How $3.6M Net Emerges From $84.5M Gross
The Core Mathematical Framework
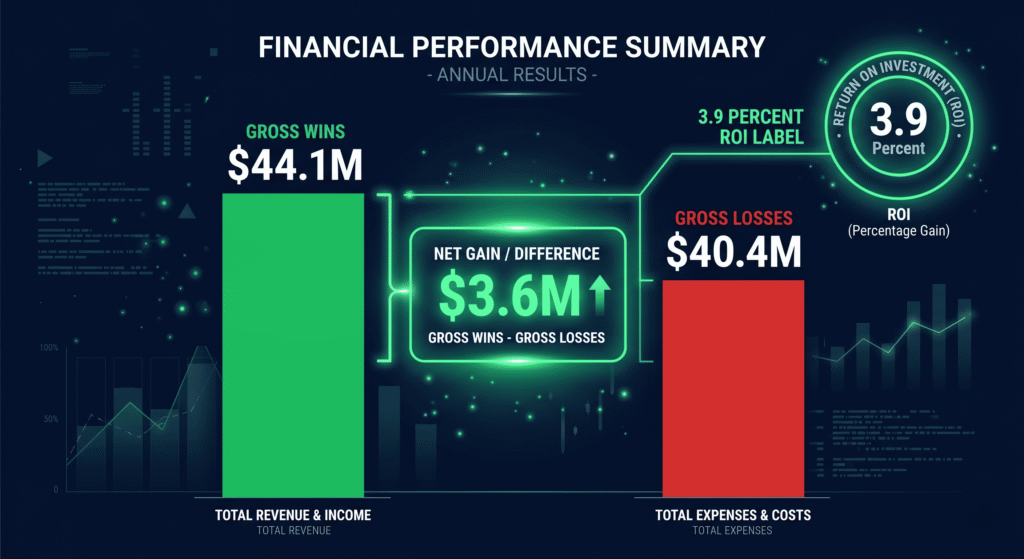
$44,100,000 in gross wins against $40,400,000 in gross losses producing $3,600,000 in net profit is the most important structural data point in the DrPufferfish profile. The 3.9% net ROI means the wallet extracts $3.90 in net profit for every $100 in gross winning volume — a thin margin at enormous scale.
This structure is the defining characteristic of professional prediction market scalpers. At 290,000 total trades, the average winning trade generates approximately $37,000 based on reported figures, while losing trades average approximately $11,000. The 3.36x ratio between average win size and average loss size — not the win rate — is the primary profit driver.
This is why a 48.4% to 53% win rate still produces $3.6M in net profit. Specifically, DrPufferfish wins less than half of all trades in its lowest-performance periods but consistently sizes winners at 3.36 times the average loser. The discipline of cutting losers fast while letting winners compound generates the gross asymmetry even when win rate falls below 50%.
The Max Drawdown Context
The -$4,200,000 maximum drawdown is the largest confirmed drawdown figure in the current CoinTrenches tracked set. This exceeds imnotawizard’s $2,445,362 Liverpool loss, dhdhsjsj’s $1,863,346 multi-sport day, and every other documented single-period loss in the research.
At 290,000 trades, a -$4.2M maximum drawdown represents a 9.5% peak-to-trough decline relative to the gross winning volume. For a wallet generating $44.1M in gross wins across a year, absorbing a $4.2M drawdown period and recovering to $3.6M net positive is the performance signature of a model with genuine long-term positive expectancy that can sustain adverse variance without collapsing.
The Liverpool Edge: $1.6M From 123 Positions
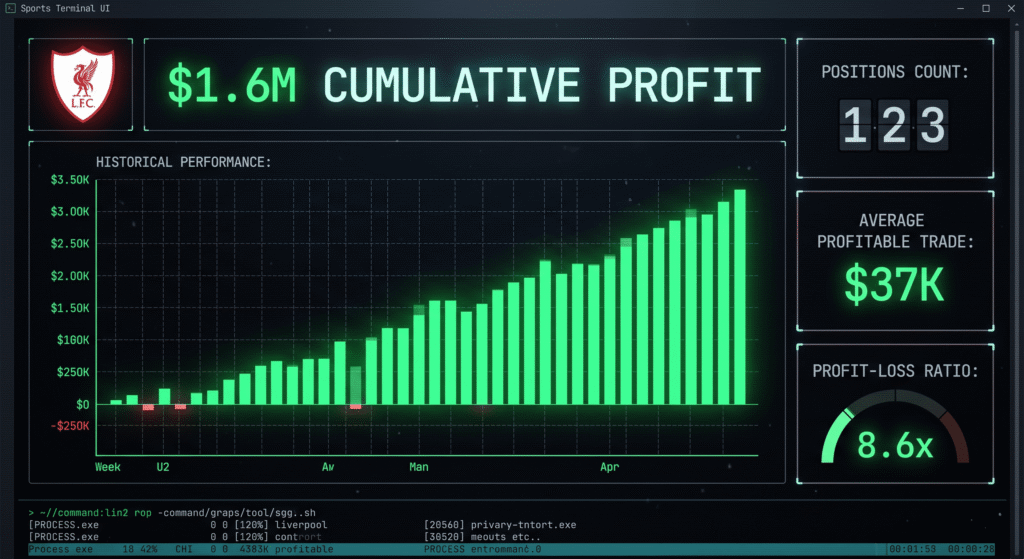
The most documented individual market thesis in the DrPufferfish record is a concentrated Liverpool FC prediction position set. Specifically, approximately $1,600,000 in net profit came from 123 individual Liverpool-related positions across Premier League and UEFA markets.
At $1,600,000 net from 123 positions, the average net profit per Liverpool position is approximately $13,008. The reported average profitable trade of $37,000 against controlled losses implies a win rate on Liverpool positions above the portfolio average, combined with significantly larger average winning positions than losing positions on this specific team.
The 8.6x profit-to-loss ratio on Liverpool positions specifically — compared to the portfolio-wide 3.36x ratio — confirms this is not general sports spread trading applied uniformly. It is a specific, concentrated analytical edge on one team’s outcome markets that generates far higher per-trade returns than the broader portfolio.
What the Liverpool Edge Actually Is
In Polymarket’s prediction market ecosystem, team-specific edges emerge from consistent crowd mispricing of specific teams in specific contexts. Liverpool as a Premier League contender and UCL semi-finalist in 2025 to 2026 represents a team with strong media narrative that crowds often misprice in two directions simultaneously: overpricing Liverpool as a favourite in certain markets and underpricing Liverpool as a contender in others.
A trader who correctly identifies the specific contexts where Liverpool is mispriced in one direction — and who builds 123 positions at meaningful size across those specific contexts over a season — generates the asymmetric $1.6M net figure from one team that the broader portfolio does not replicate across all teams uniformly.
This is consistent with the professional sports trading model where the edge is not “bet on sport X” but rather “this specific team is consistently mispriced by the crowd in this specific context.” The 8.6x profit-to-loss ratio confirms the Liverpool thesis is real analytical edge rather than general sports luck.
The In-Play Scalping Strategy: Speed as the Core Edge
How Live Event Scalping Works on Polymarket
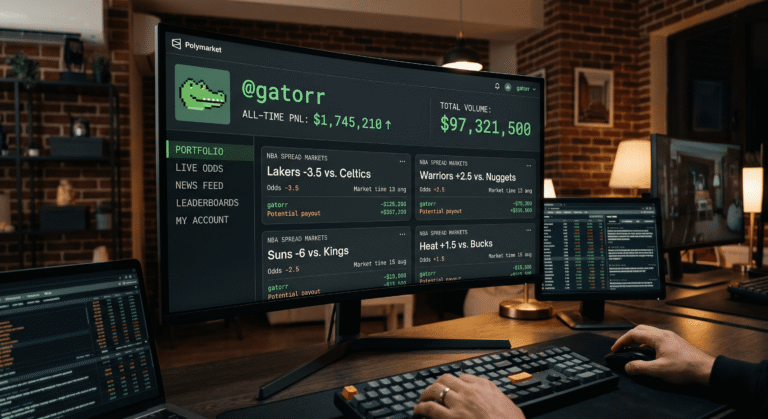
DrPufferfish actively trades live in-play sports markets on Polymarket — entering and exiting positions during active matches as momentum shifts and crowd pricing lags behind real-world developments. Specifically, tools like TradeOnsight are referenced in community discussions around the wallet, suggesting professional infrastructure for in-play execution speed.
In-play prediction markets create a specific type of mispricing that does not exist in pre-match markets. When a significant event occurs in a live game — a goal, a red card, a momentum shift — Polymarket’s crowd pricing requires time to update as individual participants respond to the information. A professional trading infrastructure that can enter the correctly-repriced outcome within seconds of the in-game event captures the spread between the old crowd price and the new equilibrium price before the market corrects.
At 290,000 total trades across 13 months, DrPufferfish is executing approximately 22,300 trades per month or 741 per day. This execution rate is not achievable through manual trading — it confirms automated execution infrastructure running continuously across active live sports markets.
The Market Calendar Alignment
The 2026 trading environment is specifically favorable for the in-play scalping model. Polymarket saw $4 billion to $6 billion-plus in weekly notional during peak periods, with sports categories accounting for 40% to 85% of US-facing volume on hybrid platforms. UEFA Champions League, NBA playoffs, Roland Garros tennis, and IPL cricket all ran simultaneously in the April to May 2026 window — creating continuous live event opportunities across multiple time zones throughout each trading day.
A scalper running simultaneously across UEFA matches in the afternoon, NBA playoff games in the evening, and ATP tennis matches throughout the day generates the continuous trade volume visible in the 741 daily average. Each sports category provides 3 to 6 hours of active in-play windows daily across different time zones.
The Hedging Model: Losing to Win
How DrPufferfish Uses Losing Trades Productively
One of the most analytically distinctive features of the DrPufferfish strategy is the deliberate use of hedging positions that are expected to lose. Specifically, analysis of the trading record shows approximately $2,000,000 in one documented period going to hedging trades that resolved as losses — but those losses protected a larger book of winning positions from adverse outcomes.
This is structurally identical to the approach used by eb99999 holding both Iran airspace closure Yes and Iran peace deal No simultaneously, or newdogbeginning’s simultaneous Senate Republican Yes and No positions. The hedging positions generate portfolio-level protection at the cost of per-trade loss recognition.
At the scale of $44.1M in gross wins, absorbing $2M in deliberate hedging losses to protect the broader position is a rational capital management decision. The hedging cost is the insurance premium on the larger winning book.
The Championship Coverage Model
A specific documented hedging structure involves spreading capital across 27 teams in championship markets where the combined implied probability exceeds 50%. Specifically, in a tournament with 20-plus teams where no single team has above 15% win probability, buying small positions across multiple contenders collectively creates a portfolio where the correct team’s payout exceeds the combined cost of all the losing positions.
This is the same structural logic as GamblingIsAllYouNeed’s scatter dip-buying model but applied to tournament markets rather than individual match outcomes. The 27-team coverage creates a synthetic near-certainty that one position in the set resolves correctly, while the individual entry prices are low enough that the winning position’s payout exceeds the total investment across all 27.
The Politics and Macro Overlay
Alongside the sports-dominant strategy, DrPufferfish maintains active exposure in political prediction markets. Specifically, documented activity in 2028 presidential nominee markets and geopolitical events including ceasefire odds generated profit runs of $26,000 to $35,000 per entry scaling to $82,000 to $98,000 in profits.
The 2028 election markets are particularly active in the current Polymarket environment. Leaderboard data from the April to May 2026 period shows “2028 nominees” as a consistent top-5 volume driver alongside live sports and BTC thresholds. DrPufferfish’s presence in this category alongside the sports core confirms the multi-category approach — geopolitics and politics provide lower-volume but higher-edge opportunities that supplement the continuous sports scalping base.
Additionally, the crypto threshold markets (BTC and ETH 5 to 15-minute Up or Down) appear in the trading footprint — consistent with BoneReader’s and k9Q2mX4L8A7ZP3R’s approaches to BTC binary scalping. The presence of crypto micro-scalping alongside live sports confirms DrPufferfish operates across all three primary Polymarket volume categories simultaneously.
DrPufferfish vs The Current Platform Landscape
| Wallet | All-Time PnL | Trades | Win Rate | Style |
|---|---|---|---|---|
| SwissTony | +$7.06M | 96,326 | 62% | Soccer ant-moving |
| GamblingIsAllYouNeed | +$5.0M | 60,535 | 33-55.9% | Scatter dip-buying |
| DrPufferfish | +$3.6M | ~290,000 | 48-53% | In-play scalping and hedging |
| sovereign2013 | +$3.4M | 39,168 | 52.6% | Sports execution |
| RN1 | +$4.1M to $4.5M | ~29,000 | 53-56% | NBA and soccer |
| LaBradfordSmith22 | +$3.4M | 669 | 67.98% | Multi-sport conviction |
DrPufferfish’s 290,000 trades is the highest confirmed trade count in the entire CoinTrenches named-wallet research set — more than three times SwissTony’s 96,326. The all-time PnL of $3.6M is achieved at the lowest win rate among the top-five by PnL — confirming the model works through average-win-exceeds-average-loss asymmetry rather than accuracy. Furthermore, the $1.3M biggest single win is the highest among sports-focused wallets in the current tracked set, confirming occasional large concentrated wins alongside the continuous small-scale scalping base.
The Risk Profile: Max Drawdown and Regulatory Awareness
The -$4.2M Drawdown
The maximum drawdown of -$4,200,000 requires context. For a wallet generating $44.1M in gross wins across 13 months, a -$4.2M peak-to-trough decline represents approximately 9.5% of gross winning volume. The wallet absorbed this drawdown and recovered to $3.6M net positive — confirming positive long-term expectancy that survived the largest adverse period.
The specific trigger of the largest loss is documented as a single Arsenal-related football market where counterparty sharp money generated $3,670,000 in profit to another trader while DrPufferfish held approximately $1,360,000 in opposing positions. This is the imnotawizard risk from the other side: when a conviction winner at scale faces concentrated sharp money on the opposite side, the loss is institutional rather than retail.
What Working Against Sharp Money Means
The documented loss from the Arsenal market counterparty confirms that DrPufferfish’s scale of operation brings it into direct competition with other professional-level operators. Unlike retail prediction market participants who lose to DrPufferfish on mispricings, DrPufferfish itself faces sophisticated counterparties on the other side of its larger positions.
This dynamic — large traders competing against each other on major sports events — is the defining characteristic of Polymarket’s 2026 competitive landscape. The Copy-Trading guide documents how to navigate this correctly. When two credentialed high-volume wallets take opposing positions in the same market, neither side has a decisive edge and the correct response is not to follow either.
Key Takeaways for CoinTrenches Readers
The $44.1M in gross wins against $40.4M in gross losses is the most important structural signal in the DrPufferfish profile. It confirms the model generates genuine positive expectancy at scale — not through win rate dominance but through disciplined asymmetric sizing where average wins exceed average losses by 3.36x. This structure has been maintained across 290,000 trades and 13 months of operation.
The $1.6M Liverpool edge from 123 positions is the single most actionable analytical insight in the profile. A team-specific market edge generating 8.6x profit-to-loss ratio across 123 positions is not luck. It is consistent identification of specific crowd mispricings on one team across multiple market types over one season. The approach confirms that deep specialisation in specific team outcome markets generates higher per-trade returns than broad sports spread trading.
The -$4.2M maximum drawdown confirms the hedging model does not prevent all large adverse periods. At 290,000 trades, variance events occur regardless of risk management quality. The survival and recovery from a -$4.2M drawdown to +$3.6M net confirms the model’s robustness — but traders considering any copy of the strategy should understand that drawdowns of this magnitude are expected events within the framework, not anomalies.
The 741 daily trade average confirms fully automated execution. No manual trader enters 741 prediction market positions per day across live sports, crypto, and political markets simultaneously. The professional tool infrastructure is the operational prerequisite for this model — not the analytical framework alone.
Keep Reading on CoinTrenches
| Whale | All-Time PnL | Category | Link |
|---|---|---|---|
| SwissTony | +$7.06M | Soccer Arb | SwissTony Polymarket: $7M All-Time, $722M Volume |
| GamblingIsAllYouNeed | +$5M | Sports Scatter | GamblingIsAllYouNeed Polymarket: $5M PnL, $401M Volume |
| LaBradfordSmith22 | +$3.4M | NBA and Soccer | LaBradfordSmith22 Polymarket: $3.4M All-Time Updated |
| sovereign2013 | +$3.4M | Sports Bot | sovereign2013 Polymarket: $3.4M All-Time, Sports Bot |
| gfjoigfsjoigsjoi | +$2.93M | High-Conviction | gfjoigfsjoigsjoi Polymarket: $2.93M on 22 Bets, 83% Win Rate |
| Cannae | +$1.9M to $2.1M | Soccer | Cannae Polymarket: $1.9M All-Time, Soccer Whale |
| newdogbeginning | +$1.07M | Multi-Category | newdogbeginning Polymarket: $2.7M Open, Senate Midterm Hedge |
| pinebluff | Positive | LoL Esports | pinebluff Polymarket: $681K Open, League of Legends Whale |
| wan123 | +$1.1M | Mixed Sports | wan123 Polymarket: $1.1M Net PnL, $854K Open |
| eb99999 | +$636K | Iran Geopolitics | eb99999 Polymarket: $988K Open, 100% Win Rate |
| 0x492442 | -$11M Net | NBA Bot | 0x492442 Polymarket: $96M Gains, -$11M Net, NBA Bot |
Frequently Asked Questions
Who is DrPufferfish on Polymarket?
DrPufferfish is a Polymarket high-frequency sports and multi-category scalper at wallet 0xdb27bf2ac5d428a9c63dbc914611036855a6c56e. The account has been active since May 2025 and has executed approximately 290,000 trades across 1,589-plus markets in 13 months. All-time net PnL is $1,960,000 to $3,600,000 depending on measurement methodology, with $3,600,000 as the most comprehensive confirmed figure. DrPufferfish ranks in the top 15 to 20 overall by PnL on Polymarket and in the top 1% by lifetime profit.
How does DrPufferfish make money at a sub-53% win rate?
The positive net PnL at 48.4% to 53% win rate comes from asymmetric position sizing — average profitable trades of approximately $37,000 against average losses of approximately $11,000, producing a 3.36x win-to-loss ratio. Cutting losing positions quickly while letting winning positions compound generates $44.1M in gross wins versus $40.4M in gross losses despite the below-50% win rate in worst periods. The Liverpool edge specifically shows an 8.6x profit-to-loss ratio from 123 positions on one team.
What is DrPufferfish’s biggest win on Polymarket?
The biggest single win is approximately $1,300,000. The specific market has not been publicly identified in the accessible data. The documented Liverpool market run generated $1,600,000 across 123 separate positions rather than a single trade, making it the most significant documented multi-position profit thesis in the profile.
What is the DrPufferfish Liverpool edge?
The Liverpool edge refers to approximately $1,600,000 in net profit generated across 123 Liverpool FC-related positions in Premier League and UEFA markets. The average profitable Liverpool trade was approximately $37,000 with a profit-to-loss ratio of 8.6x — substantially above the portfolio-wide 3.36x ratio. This team-specific edge reflects consistent identification of specific contexts where Polymarket’s crowd systematically misprice Liverpool outcomes in one direction.
How does DrPufferfish manage risk on Polymarket?
DrPufferfish uses three documented risk management techniques. First, cutting losers early to keep average loss size at approximately $11,000 versus average wins of $37,000. Second, deliberate hedging positions that are expected to lose but protect larger winning books from adverse outcomes — documented at approximately $2,000,000 in hedging losses during one analyzed period. Third, championship market coverage spreading capital across 27 teams where the combined implied probability exceeds 50%, creating synthetic near-certainty that at least one position pays out.